To enable caching for a session on an Azure Synapse Analytics SQL pool, you would execute the following command. Caching is OFF by default.
SET RESULT_SET_CACHING ON
The first time a query is executed, the results are stored in cache. The next time the same query is run, instead of parsing through all the data on disk, the result is pulled from cache. Cache is stored in memory, which is faster than performing I/O operations. However, the cache in a pool can fill up and may need to be reset. This command will clear the cache so that new or different data can be stored in memory cache. The platform itself will remove the cache after 48 hours for result sets that have not been accessed during that time.
DBCC PDW_SHOWEXECUTIONPLAN
When you run complex queries on a data source, the DBMS needs to perform some analysis to find the most efficient way to execute the query. That plan is called an execution plan. You can run the command shown in the following snippet:
DBCC PDW_SHOWEXECUTIONPLAN (distribution_id, session_id)
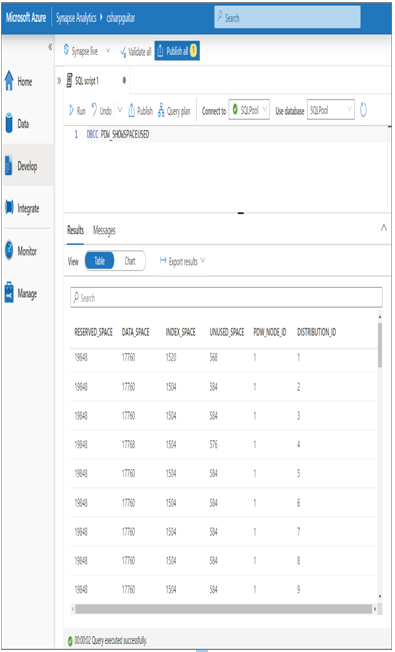
You can find the distribution_id using the PDW_SHOWSPACEUSED command illustrated in Figure 2.24. This operation is not supported on the serverless SQL pool, but only on dedicated. The session_id is an integer, which can found by executing this statement:
SELECT SESSION_ID()
The execution plan will show the template for how your SQL query is executed. You can review it to find the points of contention that can help you tune and optimize its performance.
DBCC PDW_SHOWPARTITIONSTATS
This command will show you the number of rows and space used for a given partition. The following will show those values for the READING table:
DBCC PDW_SHOWPARTITIONSTATS (“dbo.READING”)
DBCC PDW_SHOWMATERIALIZEDVIEWOVERHEAD
To refresh your memory, review the earlier section “View” where we discussed materialized views. When you run this command, passing it the schema and name of the view, it returns a ratio between the view base rows and total rows. For example, if base rows = 10 and total rows = 30, then the ratio is 3. As the ratio increases, the query uses the persisted data less and less, which results in poor query performance. You should monitor this value and identify a ratio that works for your scenario. Once the ratio breaks your threshold, you can rebuild the materialized view, which would reset the ratio to 0.

FIGURE 2.24 Output of running the PDW_SHOWSPACEUSED command
DBCC PDW_SHOWSPACEUSED
As illustrated in Figure 2.24, the amount of reserved disk space, space used for data, the amount of space taken for indexing, free space, and the node and distribution ID can be accessed using this command.
This information is useful for making sure you have enough space to run your data solution workloads.


